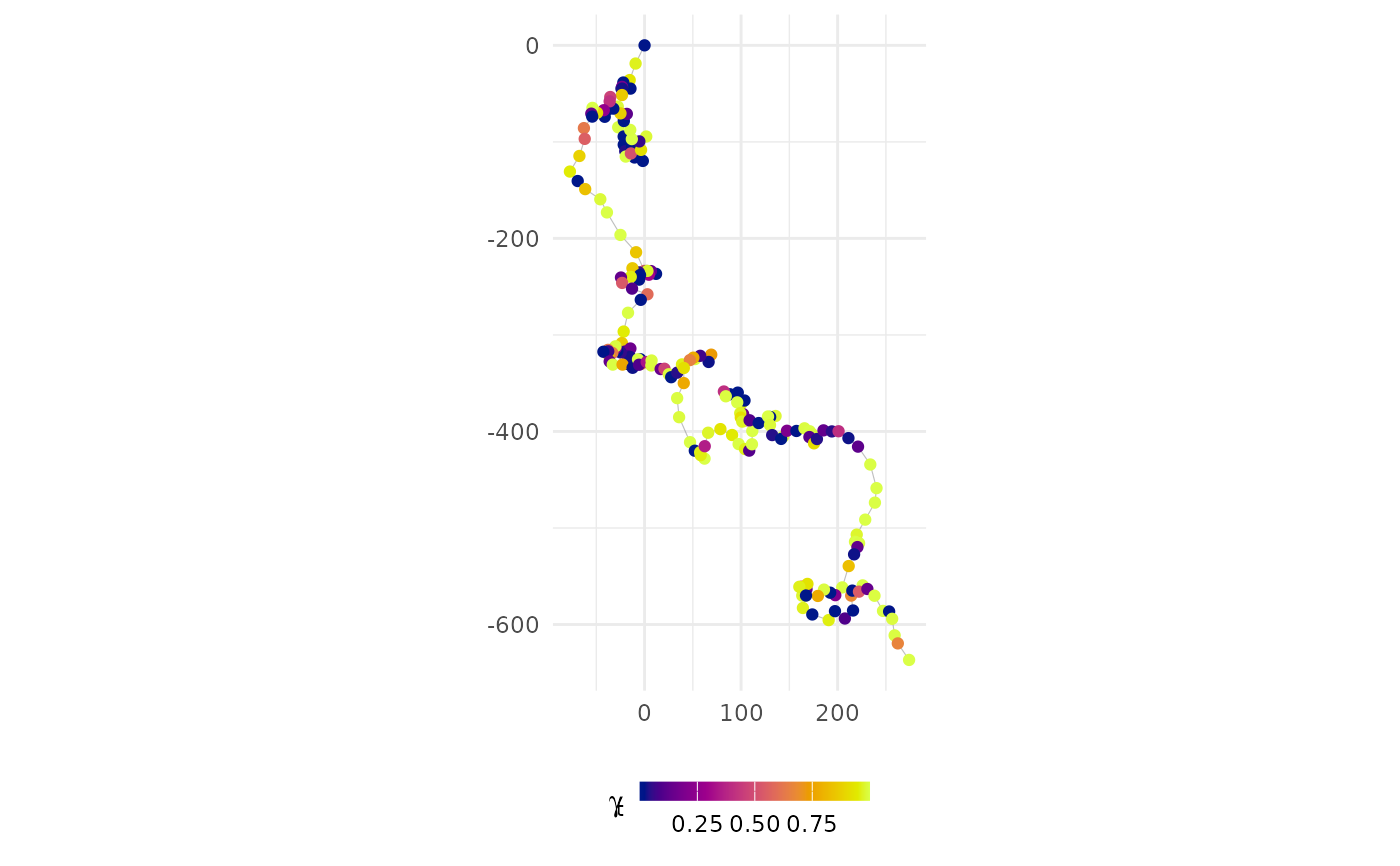
visualize simulated tracks from a sim data.frame
# S3 method for class 'sim'
plot(x, type = 2, error = FALSE, pal = "Plasma", rev = FALSE, ...)
Arguments
- x
a
aniMotumsimulation data.frame with classsim- type
either 1, a 1-D time-series of speed (if model is
rworcrwspecified behavioural states) or move persistence (g; if model ismp); or 2 (default), a 2-D track with location coloured by move persistence (g; if model = "mp")- error
logical, plot locations with error (TRUE) or without. Ignored in 1-D time-series plots
- pal
grDevices::hcl.colors palette to use (default: "Plasma"); see
grDevices::hcl.pals()for options- rev
reverse direction of colour palette; logical (default = FALSE)
- ...
additional arguments to be ignored
Value
Plots of simulated tracks. Can be rendered all on a single page (pages = 1) or on separate pages (pages = 0).